Advanced Tutorial: View Dosage Report
In this tutorial you will view a dosage report, which is fluence rate or irradiance multiplied by exposure time. Dosage values are common for UVC disinfection devices, including air ducts, water purification, or device disinfection.
Skill Level
Advanced
Downloads
none
1. Setup and Run Raytrace
In Solidworks or Rhino, setup at least one Recording Plane and run a raytrace.
By default, your recording planes will record Irradiance. If you need to record Fluence, select that option in the settings for your plane.
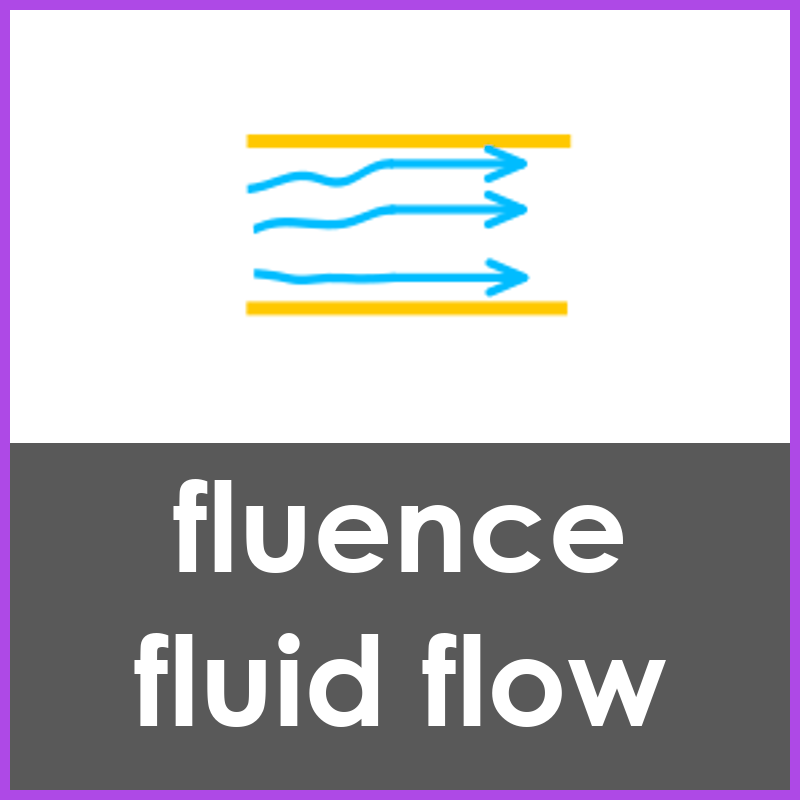
For a Fluence Fluid Flow report (air duct or water disinfection systems), refer to our setup tutorial for those projects.
REQUIREMENTS
Energy Units: Watts
Distance Units: Meters
2. Open Reports
After your raytrace is complete you'll view the results and then open up the specific dosage reports.
SOLIDWORKS
- After your raytrace, choose View Results from the Photopia CommandManager or Tools > Photopia menu.
- On the left hand side, click on the drop down arrow next to Illuminance Reports.
- Select the desired report from the drop down list. See below for descriptions of each report type.
Rhino
- After your raytrace, choose View Results in Reports from the Photopia menu or toolbar.
- In photopia|reports choose Recorder Reports on the left hand side.
- Then select the desired report icon from the screen. See below for descriptions of each report type.
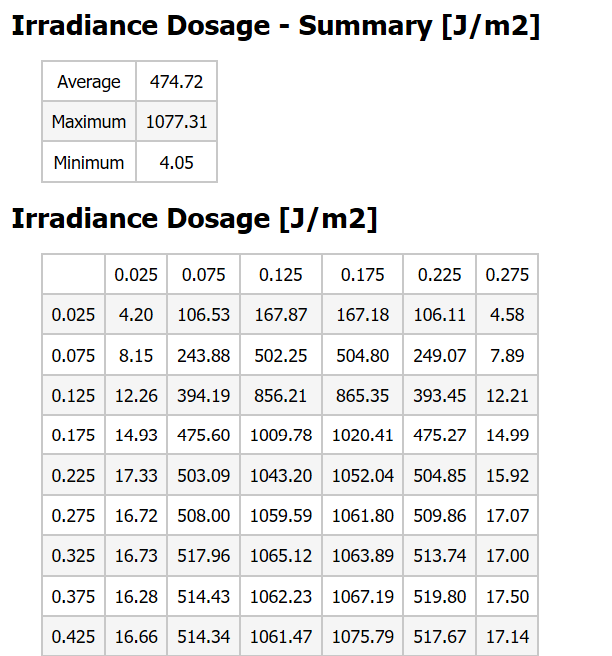
3. Exposure Time Report

In the red box at the top of the report you can update the exposure time and apply a scale factor. The scale factor is useful for testing other power levels without having to re-run a raytrace. You can also use the scale factor to switch from J/m2 to other common units.
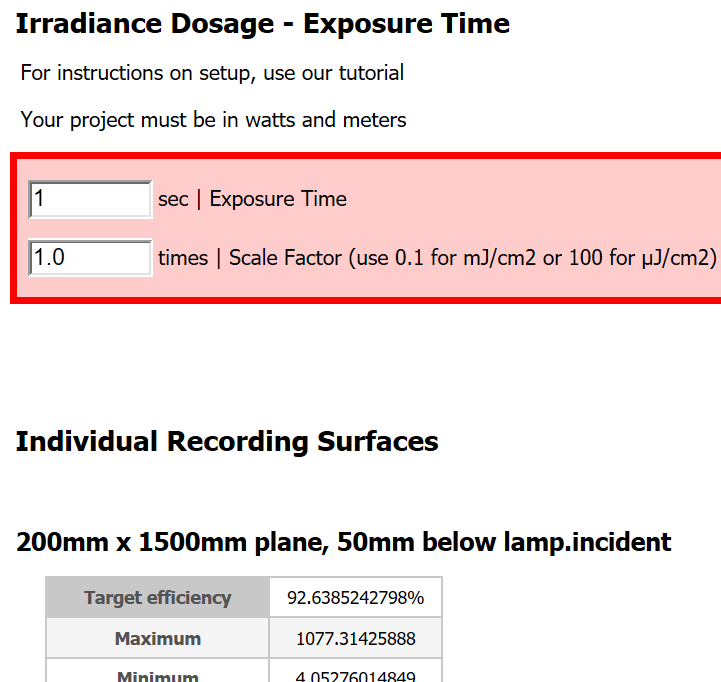
Under the standard Irradiance data for each plane in your simulation, there will also be a dosage summary and table. These are updated each time you edit the exposure time or scale factor.
4. Conveyor Report

In the red box at the top of the report you can update the conveyor speed and apply a scale factor. The scale factor is useful for testing other power levels without having to re-run a raytrace.
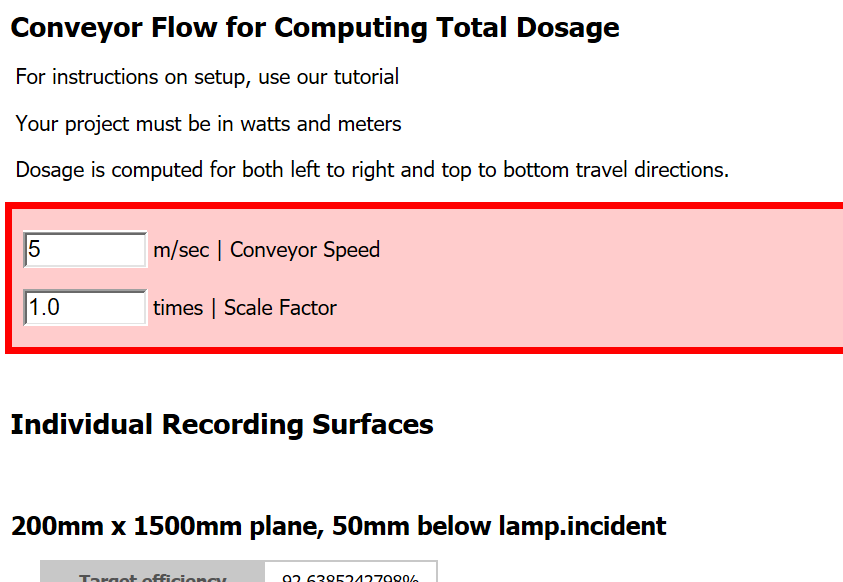
Under the standard Irradiance data for each plane in your simulation, there will also be a dosage summary and table. For a conveyor, the results are shown for movement in both directions. These are updated each time you edit the conveyor speed or scale factor.
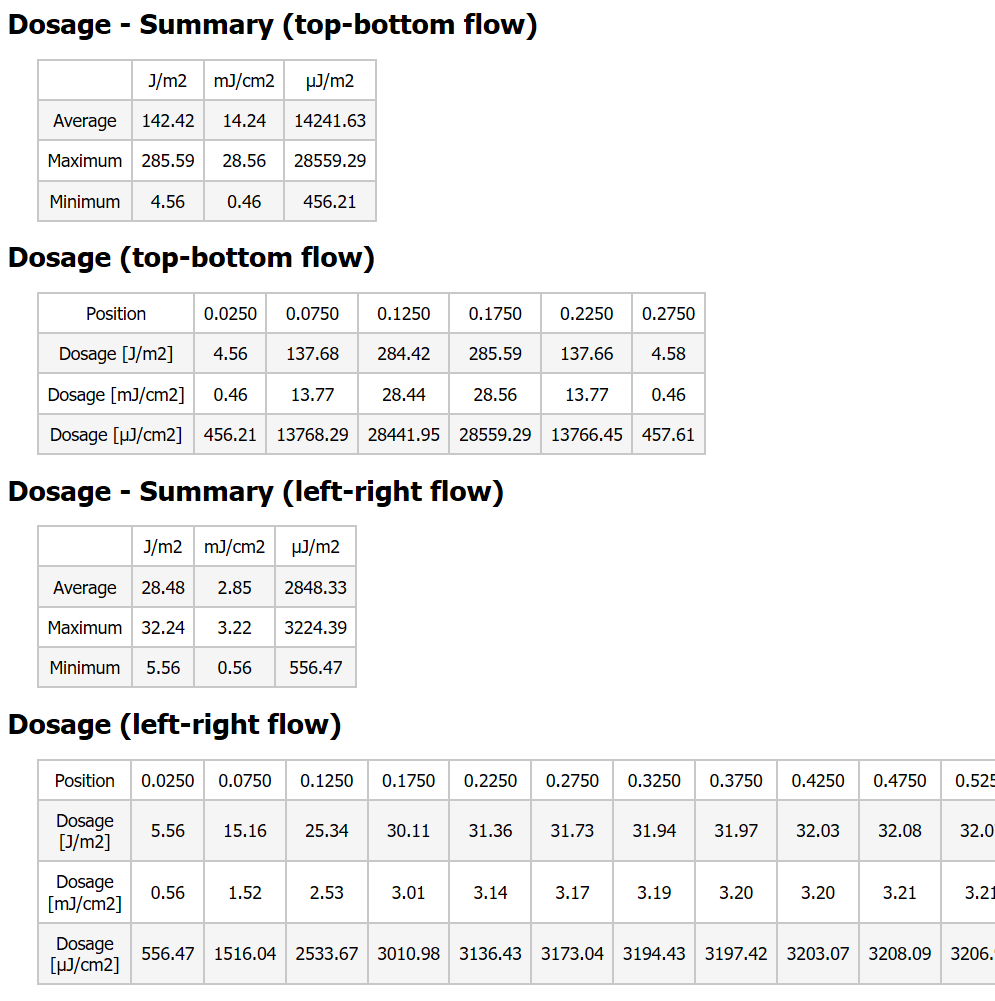
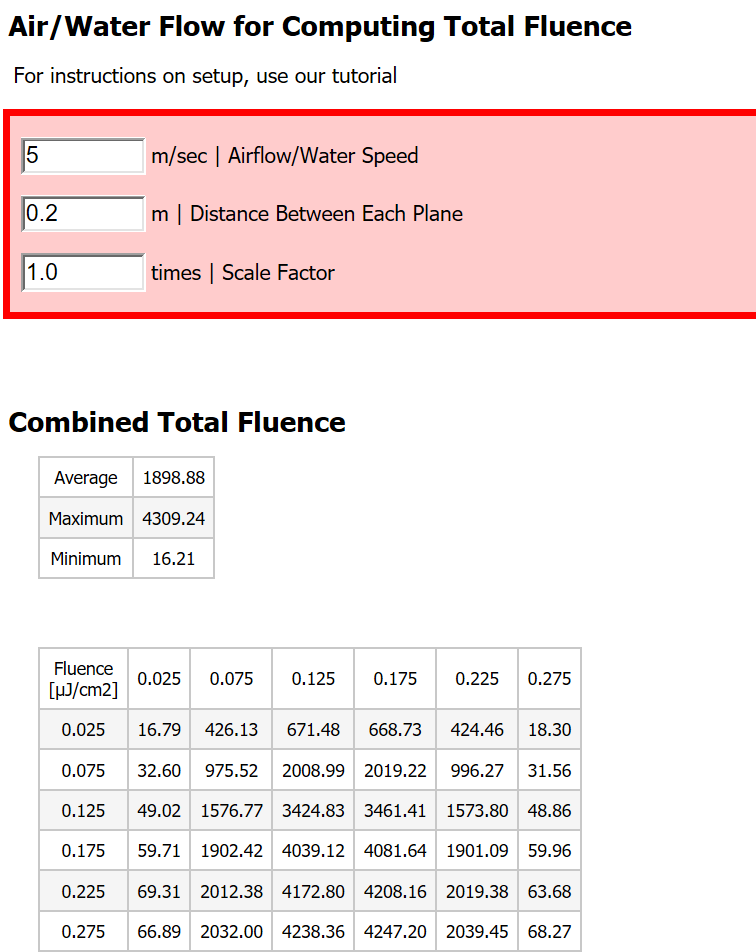
5. Fluid Flow Report
In the red box at the top of the report you can update the fluid speed, set the distance between planes to match your simulation and apply a scale factor. The scale factor is useful for testing other power levels without having to re-run a raytrace.