Contact Us
LTI Optics is always striving to improve customer support and provide you timely product updates and information to increase your productivity. If you have questions about your software, we invite you to review the sections above and check for new product downloads.
You may email support inquiries to us at the follow address: 
Should you need to call us, our support hours are 8 AM - 5 PM MST. Please review the technical support policy. Our technical support staff can be reached at 720-891-0030.
Photometric Glossary
A glossary of photometric terms, radiometric terms, colorimetric terms, and optical design terms & concepts.
For additional terms and explanations, see the following references:
- ANSI/IES LS-1-22, Lighting Science: Nomenclature And Definitions For Illuminating Engineering (https://www.ies.org/standards/definitions/)
- Optipedia - free optics information from SPIE Publications (https://spie.org/publications/spie-publication-resources/optipedia-free-optics-information)
Absorption - The total amount of light that is absorbed on or in a material. The light that is not reflected or transmitted through a material is absorbed.
Accent Lighting - Directional lighting used to emphasize a particular object or area to direct attention to that field of view.
Achromatic – The property of having no color, such as neutral white, gray or black. Commonly used to describe special lens types that reduce chromatic aberrations, or dispersion.
Ambient Lighting - Lighting throughout an area which produces general illumination.
Angstrom (Å) – 1 angstrom is a 10 billionth (10^-10) of a meter. 1 angstrom is 0.1nm. This unit is sometimes used to define wavelength. Named after the Swedish physicist Anders Jonas Ångström.
Azimuthal Angle - The lateral angle in the spherical coordinate system of the intensity distribution. Also referred to as the “horizontal angle.” Commonly designated by psi in North America and the “C plane” in Europe in architectural lighting. Designated as “H” in Type A photometry for automotive and aerospace.
Baffle - A single opaque or translucent element to shield a source from direct view of an observer at certain angles or to absorb unwanted light.
Ballast - A device used with an electric-discharge lamp to obtain the necessary circuit conditions for starting and operating.
Ballast Factor - The fractional flux of a lamp(s) operated on a ballast as compared to the flux when operated on the reference ballast used when the initial lamp lumens were determined.
Bandwidth - The wavelength range between the 50% power values on either side of the peak wavelength. Commonly used to describe the spectral width of pure color LEDs and lasers.
Beam Angle - The full angle between the 50% intensity values on either side of the peak intensity. The peak intensity may or may not be in the beam center. Also referred to as the “full width half max” (FWHM) and the “viewing angle.”
Beam Lumens - The total lumens within the beam angle of a Type B photometric distribution.
Beam Spread - The beam angle within the horizontal (H) and vertical (V) planes of a Type B photometric distribution.
BRDF / BTDF / BSDF - Bidirectional Reflectance Distribution Function / Bidirectional Transmittance Distribution Function / Bidirectional Scatter Distribution Function. These functions represent the ratio of luminance / illuminance (L/E) of a material as viewed from a given direction and illuminated from a given direction. The absolute values are a function of the specific geometric conditions under which they are measured. These values are generally used to quantify how light scatters upon reflection or transmission through a surface.
Brightness - The subjective term associated with the luminous magnitude of a surface using qualities such as bright, light, brilliant, dim or dark. The brightness of a surface is directly related to the surface Luminance via Steven’s Law, which states that the brightness ratio between 2 luminous surfaces is proportional to the cube root of the luminance ratio between the 2 surfaces. So this relationship means that it takes an 8:1 luminance ratio in order to produce the perception of a surface being twice as bright (2:1) as another since the cube root of 8 is 2.
B.U.G. Rating - IESNA TM-15 classifications for outdoor luminaires based on the absolute number of lumens in various angular zones defined as Backlight (B), Uplight (U) and Glare (G). Numbers 0 to 5 are assigned to each of these zones, with 0 being the lowest lumen output. Specific applications might require luminaires with particular BUG ratings. The lumens in the various angular zones are shown on LCS plots.
Bulb - The glass or quartz shell enclosing the luminous element of a lamp.
Candela - The International System (SI) unit of luminous intensity (candlepower). One candela is one lumen per steradian. Steradians are the units of Solid Angle. Candelas are often incorrectly interchanged with the term candlepower. Candelas are the units of candlepower, like feet is a unit for distance.
Candlepower - Equivalent to luminous intensity. The units for luminous intensity, and thus candlepower, are candelas.
Candlepower Distribution Curve - A curve, generally polar, which represents the luminous intensity of a lamp or luminaire at measured horizontal and vertical angles.
Cavity Ratio - A number indicating cavity proportions from length, width, and height. This value used in the coefficient of utilization calculation for a given luminaire in a space with specified room reflectances and dimensions.
Chromaticity Values – Chromaticity is an objective specification of a color quality separate from its luminance. Chromaticity can be specified in a number of different color spaces such as RGB and XYZ (tristimulus values). LED colors are commonly provided in the normalized lower case x,y color space, a horseshoe shaped 2D plot showing all perceived colors on a x & y axes. The u’v’ color space is a variant/transformation of xy chromaticity values, intended to be scaled as a “uniform” color space. This means numeric distances between colors in the u’v’ space should provide consistent perceived color differences no matter where the colors are on the plot. A distance between colors of 0.001 in the u’v’ color space equals 1 MacAdam ellipse, which is a just perceptible color difference for a color normal observer.
CIE (Commission Internationale de l’Eclairage) – The International Commission on Illumination, producing international standards for the lighting industry. CIE Website
Coefficient of Utilization (CU) - For a given luminaire, it is the ratio of the total luminous flux (lumens) received on the work-plane to the total luminous flux emitted by the luminaire’s lamps alone.
Color Rendering Index (CRI) – A quantitative measure of the quality of a white light source. Values range from 0 to 100, with 100 representing a perfect match to a reference white light source. The reference source is at the same CCT as the given SPDF and is a black body radiator up to 5000K and a standardized daylight spectrum above 5000K.
Colorimetry – The measurement and quantification of colors, generally for the purpose of providing consistent ways to quantitatively compare colors.
Compact Fluorescent Lamp (CFL) - A small fluorescent lamp generally made from a series of folded or twisted tubes so that the lamp can be used in much smaller luminaires than standard linear fluorescent lamps.
Correlated Color Temperature (CCT or Tcp) – The computed temperature in Kelvin (K) of a black body radiator whose perceived color most closely matches that of a given SPDF. CCT values are therefore given in degrees Kelvin. CIE standard illuminant A, for example, represents a typical tungsten filament incandescent lamp and has a CCT of 2856K. CCT’s under 3000K are generally considered to be “warm white” while CCT’s over 5000K are considered to be “cool white” colors.
Delta u'v' – A measure of the perceived color uniformity on a surface or in an intensity distribution. The “delta u’v’ from average” recorder plot allows you to view quantitative color differences in the uniform u'v' color space. In this color space, a value of 0.001 shows 1 MacAdam ellipse away from the average color, which is a just perceptible color difference. Beam color uniformity requirements sometimes specify an allowable range in this color space, such as 0.004 or 4 MacAdam ellipses.
Diffuse - The characteristic of a surface to scatter reflected or transmitted light. Strictly speaking, a diffuse surface exhibits a constant luminance from all viewing directions. However, the term is used for surfaces which only approach this ideal. A white wall is an example of a diffuse surface. Perfectly diffuse surfaces are also sometimes called Lambertian.
Diffuser - A device to redirect or scatter the light from a source. A translucent white plastic sheet is an example of a diffuser
Direct Component - That portion of the light from a luminaire which arrives at the work- plane without being reflected by room surfaces.
Discomfort Glare - Glare producing discomfort.
Dispersion – A measure of the spatial or angular separation of the component colors of broad spectrum (white) light due to the varying index of refraction of a lens material or from the varying diffraction from a grating.
DLC (Design Lights Consortium) - An organization that provides decision makers with data and resources on quality lighting, controls, and integrated building systems to reduce energy, carbon, and light pollution. For example, the DLC defines minimum performance guidelines for a range of product types that allow them to qualify for energy efficiency rebates from various organizations. Design Lights Consortium Webpage
Dosage – The irradiance or fluence rate multiplied by time in seconds to get joules/area. The metric used to determine the kill rates of various types of pathogens or the degree of a photo-chemical reaction, such as ink or adhesive curing.
Downlight - A small direct luminaire which directs the light downward.
Downward Component - The portion of the light from the luminaire emitted into the lower hemisphere.
Efficacy - Typically the output lumens per watt of input electrical power. Also, see the various Luminous Efficacy definitions.
Efficiency - Typically the output lumens / input lumens, represented as a %. See Luminaire Efficiency for more details.
Electromagnetic Spectrum - The full range of electromagnetic radiation, generally defined by frequency or wavelength. The spectrum is divided into various bands. From short to long wavelengths, these include gamma rays, X-rays, ultraviolet (UV), visible (VIS), infrared (IR), microwaves and radio waves. Optical designs are generally done within the UV, VIS & IR ranges. Furthermore, the UV & IR bands are subdivided. Band boundaries vary by reference, but are commonly described as 10-120nm (Extreme UV (EUV)), 100-280nm (UV-C), 280-315nm (UV-B), 315-400nm (UV-A), 380-780nm (VIS), 750-1400nm (Near IR (NIR)), 1400-3000nm (Short-wavelength IR (SWIR)), 3000-8000nm (Mid-wavelength IR (MWIR)), 8000-15000nm (Long-wavelength IR (LWIR)).
Equipment Operating Factor - It is commonly assumed that a ballast operated at its rated input voltage delivers rated wattage to a lamp and that a lamp operated at its rated wattage delivers its rated lumen output. This is a factor to adjust to the specific combination of luminaire, lamp type, and ballast used in a system.
Exitance - The density of radiant flux leaving a surface at a point. The units of radiant flux can be lumens, radiant watts or photon flux.
Exitance Coefficient - A coefficient similar to the coefficient of utilization used to determine wall and ceiling exitances.
FAA (Federal Aviation Administration) – US organization that defines all types of standards, including photometric standards, for the aerospace industry. FAA Webpage
Field Angle – The full angle between the 10% intensity values on either side of the peak intensity. The peak intensity may or may not be in the beam center.
Field Lumens – The total lumens within the field angle of a Type B photometric distribution.
Field Spread – The field angle within the horizontal (H) and vertical (V) planes of a Type B photometric distribution.
Filter - A device used for changing the magnitude or spectral composition of the light from the luminaire.
Fixture - Another name for a luminaire.
Fluence - Fluence is the fluence rate multiplied by time in seconds to get joules/area.
Fluence Rate - Total radiant watts incident onto the outside of a spherical surface from any direction, divided by the sphere cross sectional area, not the sphere surface area. The units of fluence rate are watts/area.
Fluorescent Lamp - A low-pressure mercury electric-discharge lamp in which a fluorescing coating transforms some of the ultraviolet energy generated into light.
Flux - See Luminous Flux
Footcandle (fc) - The Imperial unit of illuminance (lumens incident onto a surface per ft2).
FootLambert (FL) - A deprecated unit of luminance equal to pi * 1 candela / ft2.
Fresnel Reflections – A partial reflection of light at the boundary of 2 different refractive mediums. The reflectance varies by the difference in the indices of refraction, the light incidence angle and the light polarization plane. The reflectance increases with larger differences in indices and at steeper incidence angles.
Frequency – The electromagnetic spectrum can be ordered by frequency or wavelength. The frequency is the number of wave cycles per second, with units of Hertz (cycles/s). Frequency is therefore the speed of light divided by the wavelength. The visible spectrum is from about 400 THz (red) to 750 THz (violet). A THz is a Terahertz, which is 1 trillion hertz. As the trend shows, higher frequency light gets shorter in wavelength.
Full Width Half Max (FWHM) – The full width half max of an intensity distribution or spectral peak. FWHM is used interchangeably with “beam angle.” It’s also used to describe the spectral width (bandwidth or linewidth) of pure colors LEDs & lasers. In this case, it refers to the wavelength range between the 50% power values on either side of the peak wavelength.
General Diffuse Light - Lighting involving luminaires which distribute 40 to 60 percent of the emitted light downward and the balance upward.
General Lighting - Lighting designed to provide a substantially uniform level of illumination throughout an area, exclusive of any provision for special local requirements.
Glare - The sensation produced by luminance within the visual field that is sufficiently greater than the luminance to which the eyes are adapted to cause annoyance, discomfort, or loss in visual performance and visibility.
Goniophotometer - A device on which a luminaire or lamp is mounted such that a photocell can be rotated around it at precise angles to obtain the luminous intensity distribution. Photometric laboratories use goniophotometers to measure the light distributions of luminaires and lamps. From the Greek roots: gonio (angle), photo (light), meter (measure).
High Intensity Discharge Lamp - An electric discharge lamp, including groups of lamps known as mercury vapor, metal halide, high pressure sodium, and low pressure sodium.
High Pressure Sodium - High intensity discharge (HID) lamp in which light is produced by radiation from sodium vapor operating at a partial pressure of about 1.33 x 10⁴ Pa (100 torr). Includes clear and diffuse coating.
Horizontal Angle – The lateral angle in the spherical coordinate system of the intensity distribution. Also referred to as the “azimuthal angle” or “lateral angle.” Commonly designated by psi in North America and the “C plane” in Europe in architectural lighting. Designated as “H” in Type B photometry and “X” for Type A photometry for automotive and aerospace.
IES (Illuminating Engineering Society) (https://www.ies.org/) – The North American organization producing standards and educational materials for the lighting industry. IES Webpage
Illuminance (E) - The density of the luminous flux incident on a surface; lumens per unit area onto a surface. The units are footcandles (lumens/ft2) or lux (lumens/m2).
Illumination - The act of illuminating or state of being illuminated.
Incandescent - A lamp in which light is produced by a filament heated to incandescence by an electric current.
Index of Refraction (n) – A value representing how much a light path bends or refracts when entering or exiting a different refractive medium, such as air to glass. It also represents 1 over the ratio of the speed of light in the medium compared to a vacuum. So light travels at half its speed in a vacuum when in a material with a refractive index of 2, for example. The refractive index is used in Snell’s Law of Refraction to determine the angle of light refracting across a material interface. Refractive indices for materials generally vary by wavelength, increasing at shorter wavelengths. Common values are 1.491 for acrylic and 1.586 for polycarbonate near the center of the visible spectrum.
Indirect Component - The portion of the luminous flux from a luminaire arriving at the work-plane after being reflected by room surfaces.
Integrating Sphere – A measurement device that is used to add up (integrate) all light reflected, transmitted or emitted from a test sample, depending on the sphere configuration. Common uses are to measure the total integrated reflectance or transmittances of materials. The total lumen output and spectrum of lamps are also measured in integrating spheres. The benefit of the sphere is that it can quickly quantify the full output of the materials or lamps, generally by just 2 measurements of a reference and the device under test. The trade-off is that no directional data is collected for the output of the device under test.
Intensity (I) - A shortening of the term luminous intensity.
Inverse Square Cosine Law -
The equation for determining the illuminance at a point, given a luminaire position and intensity distribution. The equation assumes the luminaire is a point source. First published in 1760 in Photometria, by Johann Heinrich Lambert.
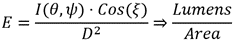 Where:
E: Illuminance [in footcandles (FC) for D in feet and in Lux (lx) for D in meters]
I(θ,ψ): Luminous intensity at a given horizontal(θ) and vertical(ψ) angle in the candela
distribution.
ξ: The incidence angle of the light directed onto the point being illuminated.
D: The distance between the center of the luminaire and the point being
illuminated.
Where:
E: Illuminance [in footcandles (FC) for D in feet and in Lux (lx) for D in meters]
I(θ,ψ): Luminous intensity at a given horizontal(θ) and vertical(ψ) angle in the candela
distribution.
ξ: The incidence angle of the light directed onto the point being illuminated.
D: The distance between the center of the luminaire and the point being
illuminated.
Irradiance - The density of the radiant flux incident on a surface; radiant watts per unit area onto a surface. The units are generally watts/m2, watts/cm2, mW/cm2, µW/cm2. Conversion from W/m2 to mW/cm2: multiply by 0.1. Conversion from W/m2 to µW/cm2: multiply by 100.
Isofootcandle Line - A line plotted on any appropriate set of coordinates to show all points on a surface where the illuminance is constant. A series of such lines for various illuminance values is called an isofootcandle plot.
Lambert (L) - A unit of measurement of luminance equal to 1 candela per square centimeter.
Lambertian – A perfectly diffuse emitter or reflector, meaning the intensity distribution of light emitting from the surface varies by the cosine of the angle away from the surface normal. For a Lambertian emitter, the lumen output equals the normal intensity value times pi. Named after Johann Heinrich Lambert.
Lamp - A generic term used for a man-made source of light. The lamp includes a base, filament (or arc tube) and a bulb. By extension, the term is also used to denote sources that radiate in regions of the visible spectrum.
Lamp Burnout Factor - While a specific lamp’s burn-out is impossible to predict, a group of lamps will fail predictably.
Lamp Position(titl) Factor - This factor accounts for the fact that lamps will generate a reduced output in some orientations, most prevalent in HID sources.
Lamp Lumen Depreciation Factor - The multiplier to be used in illumination calculation to elate the initial rated output of light sources to the anticipated depreciation of the lamp lumens when used over an extended period of time.
LED - See Light Emitting Diode.
Lens - A glass or plastic element used in luminaires to change the direction and control the distribution of the light.
Light - Radiant energy that is capable of exciting the retina and producing a visual sensation. The visible portion of the electromagnetic spectrum (light) extends from about 380 to 780 nm.
Light Emitting Diode - A light source based on a small die or chip made from semiconductor materials. The light generated is incoherent and in a narrow spectrum, with the wavelength determined by the specific composition and condition of the semiconducting material. LED’s are capable of generating radiant flux in the visible, infrared and near-ultraviolet range. White LED’s are based on chips that emit light in the blue wavelengths combined with one or more phosphors that add yellow and red wavelengths to the total distribution. LED’s are supplied in many forms, many of which are embedded within packages that include lenses to control the pattern of emitted light.
Light Loss Factor - A factor used in calculating illuminances after a given period of time and under specified conditions. It takes into account the dirt accumulation on luminaires and room surfaces, lamp depreciation, maintenance procedures and atmosphere conditions.
Light Output Ratio (LOR) – See efficiency.
Linewidth – See bandwidth.
Louver - A series of baffles used to shield a source from view at certain angles or to absorb unwanted light.
Low Pressure Mercury Lamp - A discharge lamp (with or without phosphor coating) in which the partial pressure of the mercury vapor during operation does not exceed 100 Pa.
Low Pressure Sodium lamp - A discharges lamp in which light is produced by radiation from sodium vapor operating at a partial pressure of about .1 to 1.5 Pa.
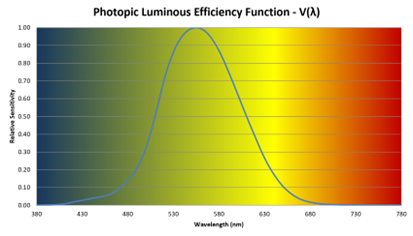
Lumen (lm) -
International System (SI) unit of luminous flux. Lumens fundamentally quantify the total amount of light produced by a luminous source. Lumens are determined by integrating the total radiant watts over the visible spectrum while weighting each wavelength according to its ability to stimulate the human visual system. The equation to determine lumens is as follows:
 Where:
λ: wavelength in nanometers (nm).
SPDF(λ): Spectral Power Distribution Function of the source, which is the amount of
radiant watts the source produces at each wavelength.
V(λ): The Photometric Luminous Efficiency Function, which is a normalized function that
represents the human eye’s relative sensitivity to each wavelength over the visible
spectrum.
All other lighting metrics result from various geometrical conditions under which lumens
are constrained. For example, measuring the number of lumens directed into a particular
region of space is the luminous intensity and measuring the number of lumens falling
onto a surface over a given area is the illuminance.
Where:
λ: wavelength in nanometers (nm).
SPDF(λ): Spectral Power Distribution Function of the source, which is the amount of
radiant watts the source produces at each wavelength.
V(λ): The Photometric Luminous Efficiency Function, which is a normalized function that
represents the human eye’s relative sensitivity to each wavelength over the visible
spectrum.
All other lighting metrics result from various geometrical conditions under which lumens
are constrained. For example, measuring the number of lumens directed into a particular
region of space is the luminous intensity and measuring the number of lumens falling
onto a surface over a given area is the illuminance.
Lumen Method - A lighting design procedure used for predetermining the relation between the number and types of lamps or luminaires, the room characteristics, and the average illuminance on the work-plane. It takes into account both direct and reflected flux.
Luminaire - A complete assembly consisting of a lamp or lamps together with other parts intended to help distribute the light, position and protect the lamps and connect the lamp to the power supply. A luminaire is sometimes called a lighting fixture or a fitting.
Luminaire Classification System (LCS) – A polar plot that illustrates the number of lumens in various vertical and horizontal angular zones of a Type C photometric coordinate system for the purpose of determining a luminaire’s B.U.G. rating.
Luminaire Dirt Depreciation Factor - The multiplier to be used in illuminance calculations to relate the initial illuminance provided by a clean, new luminaires to the reduced illuminance due to dirt collection.
Luminaire Spacing Criterion (SC) - A term defined by the IESNA that is intended to indicate the largest ratio of the luminaire spacing to the mounting height (Spacing / Mounting Height) that can be achieved while maintaining even illumination underneath an array of luminaires. This value is generally reported in directions along and across the lamp axes. Thus, values are generally reported for horizontal angles of 0 and 90 degrees, and sometimes beyond depending on the symmetry of the luminaire. The S.C. is determined by finding the lateral distance away from the luminaire at which the illuminance on a horizontal surface is ½ the value directly underneath. If the next luminaire is located at twice this distance away, then the contribution from each luminaire directly in between will equal the illuminance directly underneath the luminaire. Note that this method does not guaranty perfect uniformity of light on the work plane, just that the points directly under and directly in between the luminaires are equal.
Luminaire Surface Depreciation Factor - The ratio of luminous flux (lumens) emitted by a luminaire to that emitted by the lamp or lamps used therein.
Luminaire Efficiency - The ratio of luminous flux (lumens) emitted by a luminaire to that emitted by the lamp or lamps used therein.
Luminance (L) - The flux emitted from a surface in a given viewing direction divided by the projected area of the surface toward the viewing direction. Can also be thought of as the light emitting power of a surface. Luminance is related to the visual sensation of brightness via Steven’s Law (see definition for Brightness). Luminance is measured in candelas/ ft2 or candelas/m2. 1 nit equals 1 candela/m2.
Luminous Efficacy of a Source of Light - The IESNA defines this to be the quotient of the total luminous flux, measured in lumens, divided by the total electrical watts consumed by the source. It is expressed in lumens per watt. In the architectural lighting industry, this term is generally referred to as simply the Efficacy. In other industries, this term has been referred to as the Luminous Efficiency.
Luminous Efficacy of Radiant Flux - The IESNA defines this to be the quotient of the total luminous flux, measured in lumens, divided by the total radiant flux, measured in radiant watts. It is expressed in lumens per watt. This is also referred to as Luminous Efficacy of Radiation (LER). .
Luminous Exitance (M) - The density of luminous flux leaving a surface at a point. The lumens per unit area leaving a surface. Formerly luminous emittance. .
Luminous Flux - The time rate of flow of light. Luminous flux is measured in lumens. See the definition for the Lumen. .
Luminous Intensity (I) - The luminous flux per unit solid angle in a particular direction. The amount of light concentrated in a particular region in space. The units are candelas (lumens per steradian). .
Lux (lx) - The International System unit of illuminance. One lux is one lumen/m2 .
MacAdam Ellipse – A region on a chromaticity diagram within which colors are perceived to be the same by a color normal observer. The "radius" of a MacAdam ellipse is 0.001 in the u’v’ uniform color space. This means any color within this distance to another color will appear the same. LED colors are often binned within 2, 4 or 7 MacAdam ellipses.
Mercury Vapor - A high intensity discharge (HID) lamp in which the major portion of the light is produced by radiation from mercury operating at a partial pressure in excess of 105 Pa (approximately 1 atmosphere). Includes clear, phosphor-coated (mercury- fluorescent), and self-ballasted lamps.
Mesopic Vision – Vision under dim light conditions that involves both the rods and the cones.
Metal Halide - A high intensity discharge (HID) lamp in which the major portion of the light is produced by radiation of metal halides and their products of dissociation- possibly in combination with metallic vapors such as mercury. Includes clear and phosphor coated lamps.
Micrometer (Micron) – 1 micron is 1 millionth (10^-6) of a meter or 1000nm. The wavelength of infrared light is generally given in microns.
Nit – A unit for luminance often used in the display industry. 1 nit equals 1 candela/m2.
Nanometer (nm) – 1 nanometer is 1 billionth (10^-9) of a meter. The wavelength of visible light is generally given in nm since it’s in the range of 380 - 780nm.
NEMA Classification – The National Electric Manufacturers Association (NEMA) floodlight beam classification system is based on the “field angle” produced in the horizontal and vertical planes of a Type B photometric distribution. Field angles from 10 to 18 deg. are NEMA Type 1, then up to 29 deg. is Type 2, 46 deg. Type 3, 70 deg. Type 4, 100 deg. Type 5, 130 deg. Type 6 and wider is a Type 7.
PAR Photon Flux – Photosynthetically Active Radiation (PAR) photon flux. The photon flux limited to the range from 400 to 700nm. This unit is used in horticulture lighting, where plants mostly benefit from radiant energy in this spectral range.
Photometric Type – The photometric coordinate system is always a spherical coordinate system. Types A, B & C are differentiated by how the spherical coordinate system is oriented with respect to the beam center and how the horizontal and vertical angles are labeled. Type C is generally used for most indoor and outdoor architectural lighting. Type B is used for flood and sports lighting. Type A is generally used for automotive, aerospace, and marine lighting. See the documentation on photometric settings for more details.
Photometry - Light-measurement; the measurement of quantities associated with light.
Photon – An elementary particle that is a quantum of electromagnetic energy. The energy can be in the ultraviolet, visible or infrared part of the spectrum. A photon is informally described as a particle or packet of light, since the energy absorbed from photons onto the retina gives rise to vision, while energy absorbed from photons onto photodetectors produces a flow of electrons via the photo-electric effect. Photons are massless, but they have momentum and can therefore impinge a force onto an object. Photons travel at the speed of light (299,792,458 m/s) when in a vacuum. Light has properties of both particles and waves, so it is not clearly defined as one or the other.
Photon Flux & PAR Photon Flux Irradiance – The density of the radiant flux incident on a surface; photon flux per unit area onto a surface. The units are generally micro-mole photons/s/m2.
Photon Flux – The number of photons emitted by a source per second. Since the numbers are very large, they are generally shown in units of micro-mole photons/second. 1 mole represents 6.02214076 × 10^23 units. 1 micro-mole therefore represents 6.02214076 × 10^17 units or 602.2 quadrillion. As a reference, a 100 lumen, 4000K LED emits 1.459 micro-mole photons/s or 878.7 quadrillion photons/s. A 10 million ray simulation of this LED therefore models 11.38 pico-seconds of emission.
Photon Flux & PAR Photon Flux Intensity - The radiant flux per unit solid angle in a particular direction. The number of photons/second concentrated in a particular region in space. The units are micro-mole photons/second/steradian.
Photopia - Light-vision; vision under bright light conditions.
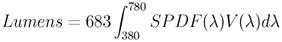
Photopic Luminous Efficiency Function (V(λ)) -
A normalized function that represents the human eye’s relative sensitivity to each wavelength over the visible spectrum under Photopic (bright light) viewing conditions. This function is used in the determination of the lumens produced by a light source.
Photopic Vision - Vision under bright light viewing conditions involving the use of the cones in the human visual system.
Point Method - A lighting design procedure for predetermining the illuminance at various points in lighting installations, by use of luminaire photometric data and the application of the Inverse Square Cosine Law.
Point Source - A source of radiation the dimensions of which are small enough, compared with the distance between the source and the irradiated surface, for them to be neglected in calculations and measurements.
Polarized Light – Electromagnetic radiation is represented by 2 perpendicular waves, the electric (E) and magnetic (M) waves. The orientation of the planes of these waves in space can vary. If all waves are oriented the same, e.g. all E waves are vertical, then the light is said to be polarized. Unpolarized light means the wave plane orientations can vary for the emitted photon paths.
Preheat Fluorescent Lamp - A fluorescent lamp designed for operation in a circuit requiring a manual or automatic starting switch to preheat the electrodes in order to start the arc.
Quantity of Light - The product of the luminous flux and the time over which it is maintained. It is the time integral of luminous flux. Quantified in terms of footcandle-hours or lux-hours, this is important to lighting analyses for plant life.
Quartz Halogen - A gas filled tungsten incandescent lamp containing a proportion of halogens in an inert gas whose pressure exceeds three atmospheres. The halogen gases combine with tungsten particles and redeposit them on the filament when contact is made. This halogen cycle takes place at a high temperature (brighter filament) and increases the life of the lamp.
Radiance - The radiant flux emitted from a surface in a given viewing direction divided by the projected area of the surface toward the viewing direction. The radiometric equivalent to the photometric value of luminance.
Radiant Efficiency – The radiant watts emitted by a source divided by the electrical watts consumed by the source itself. The measure of how well a light source converts electrical watts to radiant watts.
Radiant Energy – See watt.
Radiant Intensity - The radiant flux per unit solid angle in a particular direction. The number of radiant watts concentrated in a particular region in space. The units are radiant watts per steradian.
Radiometry - The measurement of quantities associated with electromagnetic radiation in the ultraviolet, visible & infrared bands of the spectrum.
Rapid Start Fluorescent Lamp - A fluorescent lamp designed for operation with a ballast that provides a low-voltage winding for preheating the electrodes and initiating the arc without a starting switch or the application of high voltage.
Reflectance - The ratio of the radiant energy reflected by a material to the incident energy. Reflectance can vary with the light incidence angle and wavelength (spectral reflectance). It can be quantified for specific incoming and outgoing directions (directional reflectance) or summed over an entire hemisphere (total integrated reflectance). Materials in Photopia’s library often quantify the total integrated reflectance for specific incidence angles, referred to as directional-hemispherical reflectance. The specific amount of light scattered in various directions is separately quantified in the material BSDF data.
Room Surface Depreciation Factor - The reduction of the reflectance capabilities of room surfaces due to the dirt that accumulates on these surfaces. This is dependent on the cleaning interval and the type of atmospheric conditions.
SAE (Society of Automotive Engineers) – The main trade organization setting standards for a wide range of products within the automotive industry, including all types of vehicle lighting devices. SAE Webpage
Scotopic Vision - Vision under dim light viewing conditions involving the use of the rods in the human visual system.
Shielding Angle of a Luminaire - The vertical angle at which the line of sight of the bare source, or its reflected image, first becomes visible.
Solid Angle (w) - A measure of spatial extent. It can be thought of as the 3D equivalent to a 2D angle. A way of quantifying the size of a cone or other arbitrarily shaped regions of space. It is expressed in units of steradians. The total solid angle of a sphere is 4pi.
Spectral Power Distribution Function (SPDF or SPD) – The number of radiant watts the source produces at each wavelength. Generally defined in watts/nm.
Specular Reflection – A mirror reflection. The reflected angle is equal and opposite to the incidence angle.
Spectrometer – A term along with spectrophotometer and spectroradiometer that is generally used to describe a device that measures the spectrum of light. There are many different configurations of spectrometers for different applications, but at their core, they measure the irradiance over a range of wavelengths onto a detector. The detector is often a fiber end, but can also be a cosine corrected diffuser. The irradiance will have units such as W/m^2/nm. Converting the spectral irradiance values to radiant watts per wavelength (SPDF) requires a calibration or other post processing.
Speed of Light - 299,792,458 m/s
Spotlight - A type of luminaire with a relatively narrow beam angle designed to illuminate a specifically defined area.
Steradian (sr) - The units of solid angle.
Steven’s Power Law – An empirical relationship in psychophysics between an increased intensity or strength in a physical stimulus and the perceived magnitude increase in the sensation created by the stimulus. The exponent in Steven’s Power Law for our perception of brightness is 0.33, meaning the perceived change in brightness of a surface is the cubed root of the actual change in brightness. For example, a luminance ratio of 8:1 is required to produce a perceived brightness ratio of 2:1, since the cubed root of 8 is 2. (2*2*2=8). This helps explain why lighting designers typically light areas of interest that should stand out from their surroundings with 10 times the illuminance as the surrounding area. Wikipedia Page
Target Efficiency - The number of lumens reaching a given "target area" divided by the total lamp lumens in the luminaire.
Task Lighting - Lighting directed to a specific surface or area that provides illumination for visual tasks.
Temperature Factor - This represents the thermal factor of the installation that compensates for the light losses or gains due to luminaire temperatures which differ from test conditions.
TM-30 (IESNA) – The IES standard that defines 2 color quality metrics, Rf & Rg, that quantify the fidelity and gamut of a given SPDF compared to a reference white light source. The reference light sources being a black body, daylight or a combination depending on the CCT. Rf & Rg values range from 0 to 100, just like CRI. TM-30 is meant to improve upon the shortcomings of CRI and be a better predictor of people’s color preference between 2 light sources.
For a more in depth overview of TM-30, see this DOE fact sheet. For a complete description, get the IES TM-30-20 document from www.ies.org.
Total Integrated Reflectance - The fraction of incident light that is reflected from a surface into all directions. This value is also referred to as simply the reflectance. The reflectance is generally not constant for all incidence angles of light directed onto a surface. This value is measured in an integrating sphere device.
Total Integrated Transmittance - The fraction of incident light that is transmitted from a surface into all directions. This value is also referred to as simply the transmittance. The transmittance is generally not constant for all incidence angles of light directed onto a surface. This value is measured in an integrating sphere device.
Total Internal Reflection (TIR) – When light is incident onto a refractive medium boundary, going from a higher index to a lower index medium, there is a condition where the light can’t exit the high index medium. This happens when the incidence angle onto the surface boundary is beyond the “critical angle.” In this case, the light does not exit the medium and instead totally internally reflects (TIR). This is called a “total” reflection since the reflectance is 100%. The light reflects at a mirror angle to the surface normal. This is distinct from the Fresnel Reflection at the surface boundary.
Transmission - A general term for the process by which incident flux is passed through a surface.
Transmittance – The ratio of the radiant energy transmitted by a material to the incident energy. Transmittance can vary with the light incidence angle and wavelength (spectral transmittance). It can be quantified for specific incoming and outgoing directions (directional transmittance) or summed over an entire hemisphere (total integrated transmittance). Materials in Photopia’s library often quantify the total integrated transmittance for specific incidence angles, referred to as directional-hemispherical transmittance. The specific amount of light scattered in various directions is separately quantified in the material BSDF data.
Tristimulus values (XYZ) – Three values obtained by multiplying the given SPDF by the X, Y & Z “color matching functions.” The color matching functions represent the relative amount of given red, green and blue primaries, required to produce the perceived color of any single wavelength over the visible spectrum. Converting a given SPDF into XYZ tristimulus values is the first step in computing any other derived color quantities such as chromaticity values, CCT, CRI, etc. A full spectrum can therefore be represented by just these 3 values on each ray during a raytrace to produce any type of colorimetric output, such as true color beam images, chromaticity values, etc.
Troffer - A recessed luminaire installed with the opening flush with the ceiling.
Unified Glare Rating (UGR) – A relative number intended to help predict the presence of discomfort glare when viewing a lit environment containing light sources. Higher numbers mean a higher chance to perceive discomfort glare. The UGR formula is derived from a combination of other major glare formulae. A common target is to achieve a UGR value under 19 in the UGR table for room dimensions of 4H/8H and reflectance values of 20% for the floor, 50% for the walls and 70% for the ceiling. The UGR tables show a range of room aspect ratios, room surface reflectances and 2 luminaire viewing directions. The rooms are based on the assumption of a single observer position in the center of one wall, 1.2m above the floor. The room aspect ratios are in multiples of “H,” the height of the room above the observer position. The rooms are assumed to be 3.2m tall, so H=2.0m. Tables are shown for specific Spacing to Height Ratio (SHR) values. Tables for SHR=1.0 and SHR=0.25 are commonly used for different standards in different markets. Photopia Reports shows tables at both SHR values.
more details on UGR
Upward Component - The portion of the light form a luminaire emitted at angles above the horizontal.
Vertical Angle – The vertical angle in a spherical coordinate system of the intensity distribution. Commonly designated as theta in North America and gamma in Europe in architectural lighting. Designated as “V” in Type B photometry and “Y” for Type A photometry for automotive and aerospace.
Visual Task - Conventionally designates those details and objects that must be seen for the performance of a given activity, and includes the immediate background of the details or objects.
Watt – The SI unit of power, an energy flow rate, equal to the rate of 1 joule per second. In an electrical circuit, the energy comes from the flow of electrons. Radiant power or radiant energy is the flow of photons. Each joule of radiant energy converts to a specific # of photons depending on its wavelength.
Zonal Lumens – The total lumens within discrete vertical angular zones of a Type C photometric coordinate system.
How Photopia Works
Lamps
Photopia Lamp Modeling
Background
Photopia comes with a large library of lamp models for use in optical designs. Sometimes a lamp you may want to use is not in the library. In these cases, you can either construct a lamp model yourself using information in the Photopia User's Guide Appendix B, or have us construct the model for you.
Components in a Lamp Model
Lamp models in the Photopia Library contain 3 basic components: a CAD model, an IES formatted bare lamp photometric file, and luminance information for the source.
The geometry is described in an AutoCAD 2000 formatted DXF file. The model includes all of the physical geometry as well as non-physical geometry such as arc shapes. Materials are assigned to each part of the lamp model, so that the correct interactions occur wen light comes back into contact with the lamp.
The output of the lamp is described in a bare lamp photometric file. This file is created by a lab measurement of the candela distribution and lumen output of each lamp.
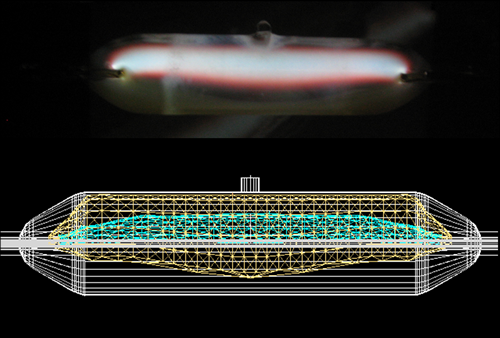
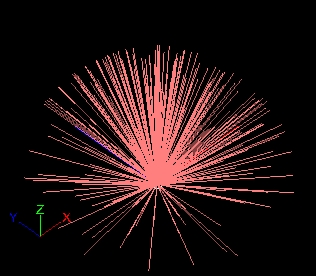
The final part of a lamp model is a description of the luminance properties of the source. For HPS and Metal Halide lamps this means determining the shape and luminance variation of the arc. The image below shows a sample 1500W Metal Halide arc tube with the arc inside, along with the Photopia model of the arc. For fluorescent sources this involves the luminance variation across the surface.
Creating your own Lamp Model
If you are looking for a lamp in the Library and don't find it, you can make your own lamp model. There are instructions for creating lamp models in Appendix B of the Photopia User's Guide, which is available by selecting Help > Documentation in Photopia.
Using an IES file for a lamp
If your luminaire uses LEDs with off the shelf secondary optics from companies such as Ledil, Carclo, Fraen, etc. and if those optics do not interact with other lenses or reflectors in close proximity, then they can be represented using a special set of lamp models in Photopia's library. The special lamp models consist of planar geometry and will emit light in a distribution driven by the IES file you assign to it. The light will be emitted uniformly from the front surface of the lamp geometry. We have created a range of models that can be used for various sized optics. You will see them in the lamp list with names that begin with "LEDLENS..." The rest of the name indicates the geometry of the source, with a single number indicating a diameter. Some of these lamp models also include several copies so you can work with multiple lens types in the same luminaire. In this case, the extra copies have numbers at the end of their name. Some of these models include:
- LEDLENS20MM (This has a round emission area)
- LEDLENS50MM (This has a round emission area)
- LEDLENS75MM (This has a round emission area)
- LEDLENS19x95MM (This has a rectangular emission area for symmetric beams. It is sized for the Ledil Florence product line.)
- LEDLENS95x19MM (This has a rectangular emission area for asymmetric beams where the main throw is perpendicular to the long axis of the lens. It is sized for the Ledil Florence product line.)
To set the lamp model's IES file, just rename your IES file to match the model name you want to use and put it into the following folder: C:\ProgramData\LTI Optics\Library\Lamps
Note that this folder is sometimes hidden by Windows, so if you don't see it in Windows Explorer then change your Folder Options to display all hidden folders and files.
Once you load the lamp into your Photopia project, then you will set its lumens, LED watts and driver watts in the Edit > Design Properties > Lamp screen to define the values appropriate for your LED, its running current, temperature and lens efficiency.
Getting a new lamp in the Library
If you are looking for a lamp in the Library and can't find it, let us know and we'll try to get it in the Library. Lamp manufacturers can have their new products included in the Photopia Library. This is a very beneficial service as your products will be seen by all of our users. You can see more information about adding a new lamp to the Library on this order form.
Raysets
LED Modeling Using Raysets
Overview
Producing accurate simulations of LED based optical systems requires accurate source models. This means the source models must not only produce the correct distribution of light in a far field measurement, they must also produce the correct near field behavior since secondary LED optics are often employed in very close proximity to the LED. Accurate simulations are vital to the design process especially with lens optics commonly used on LEDs given the high cost and long lead times for lens tooling. The data presented in the case studies below is a direct result of the lessons learned by one manufacturer about the importance of simulation accuracy.
What Are Raysets?
Raysets have become a convenient way to model light source behavior, and are commonly provided by LED vendors. A rayset is simply a collection of rays (vectors) that describe the initial emanation of light from a source. Each ray consists of a start point, direction, and magnitude (in lumens). Rayset files are ususally provided in multiple formats for compatability with most optical simulation software.
What Are Raysets Missing?
Raysets are missing one key componenet of a lamp model, geometry. Raysets only describe the exiting light and do not contain any geometric data about the light source. Since there is no geometric information, there is nothing for the light to interact with if it comes back towards the light source. Some vendors provide 3D cad models as a supplement to their raysets, but this relies on the users to assign appropriate materials to each part of the LED. Additionally, many of these CAD models don't contain enough detail but only describe the bounding volume of the package. This lack of geometry also causes an issue with accurate ray emanation points. Since there is no geometry, the ray emanation points are not coming from geometric locations, but just points in space. The process of combining the 2D images to create raysets does not seem to provide an accurate way to determine correct ray emanation points.
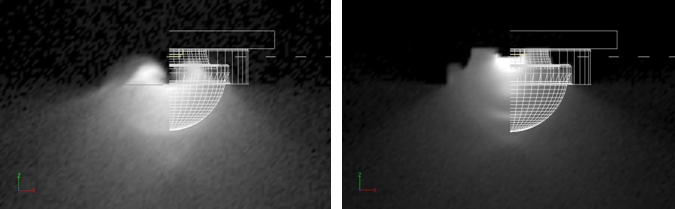
The images below show a cross section of the CREE XR-E LED. The image on the left shows the light field for a rayset based model. The geometry is included only as a reference since the rayset based model doesn't contain any geometric information. The image on the right shows a Photopia lamp model, with the associated geometry. The light field for the Photopia model looks more coherent and seems to match the geometry better than the rayset based model, which seems to indicate light coming directly behind the LED, through the package, which is a physical impossibility.
Using Raysets in Photopia
Since the original beta release, Photopia v3.0 has supported the use of raysets. You can see how to use these in Appendix B of the v3 User's Guide. Photopia uses raysets that end in a .rir extension. Radiant Imaging's ProSource software exports this format natively, and other lamp manufacturers are working on providing this format of their raysets. Our format is identical to the TracePro Binary format, so if you see this format (which ends in a .ray extension) you can use these in Photopia simply by changing the extension to .rir. When you have a .rir rayset, you'll simpy import a simple lamp model from the Photopia lamp library, and then in the Property control, choose the rayset by browsing to it. You'll also need to set the appropriate lumen value for the source model.
Rayset Accuracy
Raysets seem to have a good potential of capturing near field photometric data, however, they do have some significant limitations. Their lack of CAD geometry puts the responsibility on the user of the software to import and assign materials in order to achieve an accurate output. Additionally, because the data is compiled from a series of 2D images, raysets often don't contain accurate 3D emanation points. Of the two aspects of lamp modeling, where is the light going and where is it coming from, raysets only accurately adddress where the light is going. Without proper material assignments to the 3D geometry as well as the proper emanation points, photometric simuations can be very inaccurate. Appendix B of the Photopia User's Guide illustrates some of these issues.
In conjunction with Ruud Lighting, we've also done a series of studies that compared simulations with raysets and simulations with Photopia lamp models to measured photometry. We consistently saw very strong correlation between the Photopia lamp models and measured photometry. The match between raysets based models and measured photometry was less consistent. In any application where secondary optics will be placed close to an LED, the Photopia lamp model provides the best correlation. Since these raysets are typically generated from 2D images, they have no way to accurately determine the 3D ray emanation points, which are critical when an optic is placed close to or directly on the LED. Additionally, if an index matching gel is used to join the LED and the optic, raysets provide no way to account for this surface interaction. Case studes are included below as well as in the following papers:
LED Source Modeling Method Evaluations in the November/December 2008 issue of LED Professional Review and LED Source Models in the January/February 2009 issue of LED Journal both cover this study of physical measurements.
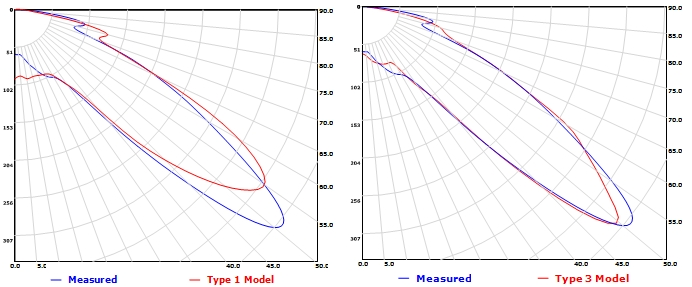
These case studies use data collected by BetaLEDTM during the development of their NanoOpticTM LED outdoor area lighting lens optics. The data includes measured luminous intensity distributions along with simulations using both Type 1 and Type 3 source models in Photopia. The optics were measured at Independent Testing Laboratories, Inc. (ITL) in Boulder, Colorado, USA. The simulations used lens geometry that was scanned from the physical as-built parts. This is important since the as-built parts did not always perfectly match the intended design, which removes a potential source of difference between measured and simulated performance.
Case 1: Roadway Type 5 Lens with Index Matching Gel between LED and Lens
The image on the left shows the measured (blue) versus rayset predicted (red) candela plot. The image on the right shows the measured (blue) versus Photopia model predicted (red) candela plot. The rayset based models are called Type 1, the Photopia models are called Type 3 based on the terminology in this paper on lamp modeling.
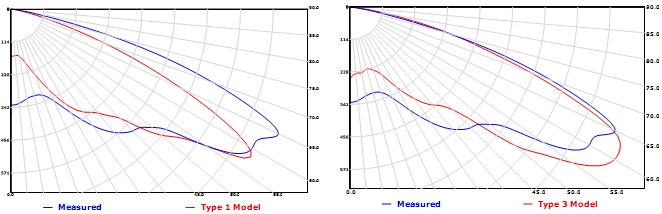
The Photopia (Type 3) model on the right predicts the beam more closely than the rayset (Type 1) model on the left. The image on the right shows that the predicted and measured candela plots trace each other more closely, especially at the higher vertical angles, which are critical in a roadway application. If the simulations are underpredicting these values, then the optimization of the optic will be misdirected. The rayset model on the left shows very significant deviations between the high angle light, the angle at which the peak intensity occurs, and the nadir intensity, all of which are main design criteria in a roadway optic.
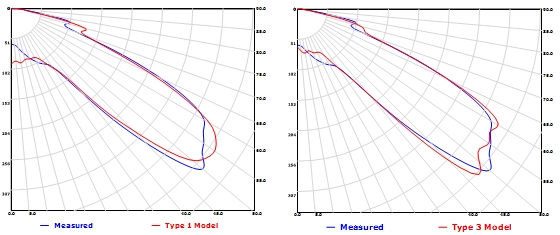
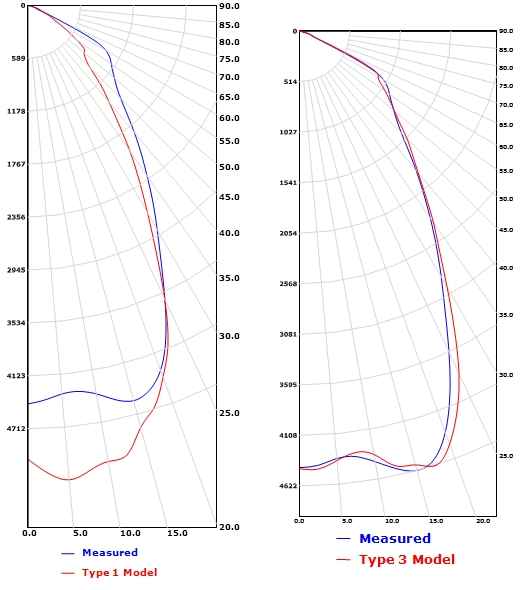
Case 2: Roadway Type 5 Lens without Index Matching Gel
The differences between the rayset and Photopia model performance are not as great as in Case 1, but the left images below do show an upward shift in the beam angle and significantly more light directly below the luminaire. Accurately predicting the peak vertical angle in the intensity distribution is another critical issue in this type of lens. The right images below show a more accurate overall beam shape and peak beam angles.
Case 3: Medium Beam Lens with Index Matching Gel
This case illustrates how the differences between the 2 model types remains significant when a gel is used between the LED and lens even in a much narrower beam distribution. The higher intensities seen in the central part of the beam using the Type 1 model on the left result from the extra lumens that were not directed to the higher angles in the distribution where they belonged. The Type 3 model results shown on the right reveal a much closer beam shape at the full range of angles in this distribution.
Summary
The 3 cases presented illustrate that there are significant differences in simulated results depending on the source modeling method used. These results show that a Type 3 model more closely matches the measured performance than the Type 1 model for both wide and medium beam lenses. The differences are greatest when an index matching gel is used between the LED and lens. The main reasons for this are that in addition to the challenge Type 1 models have in creating accurate 3D ray emanation points, all of their digital images showing the luminous view of the source are measured in air. When a gel is used between the LED and the lens, light never exits from the LED primary lens into air so the measurements are inappropriate. Since Type 3 models include the lens geometry, the material can simply be changed to account for the glass / gel interface instead of glass / air.
The 2nd set of data shows that the Type 1 model fairs better when there is no gel, yet it does not outperform the Type 3 model. Wider beam optics are more sensitive than narrower beam optics to exactly how much light is directed onto each part of the lens. As the beam gets narrower, more light is directed to the same angles in the beam and differences in the amount of light sent to each part of the lens between the simulation and physical reality become less important. It should also be noted that other 3D ray emanation point geometry mapping options were tested such as mapping the points to a sphere and the results did not vary significantly from those presented here.
Given a choice between Type 1 and Type 3 source models for the same LED, a Type 3 model will likely produce more accurate results, especially as the beam gets wider. If gels are used between the LED and lens, then Type 1 models should not be used since the measurements on which they are based is not appropriate for this situation.
The simulation data in these case studies was provided by Kurt Wilcox and Chris Strom at Ruud Lighting. ITL in Boulder, Colorado provided the physical measured data for comparison.
Materials
Photopia Materials Library
Background
Our customers rely on Photopia to produce accurate predictive photometry. Having accurate material models is necessary to have accurate output. Photopia includes a library with over 1544 measured materials from most of the major vendors that the lighting industry uses.
Our Measurement Process
LTI Optics uses a custom-built BRDF/BTDF measurement device to accurately characterize the real reflecting/transmitting properties of various materials such as semi-specular aluminum, hammertone, prismatic lenses, perforated diffusers, and many others. The measurements are collected for a wide range of light incidence angles to capture the true scattering nature of real materials (see image below). Photopia uses the measured data in lookup table format and therefore does not attempt to "curve fit" the data into standardized equations that do not model the wide range of scattering effects observed in real materials. The library of measured data also eliminates the need for the user to "guess" at the scattering properties of materials. Customers can also submit proprietary materials for measurement, ensuring the most accurate data possible for their analyses. To create an accurate material model we perform two types of measurements: integrated reflectance/transmittance, and material scattering.
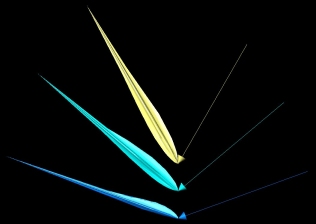
Reflected Intensity Distribution: ALANOD 1165 G3
Adding a Material to the Library
If you're looking for a material that you don't find in the Library, please let us know and we'll work on adding it. Often, you may use a custom material that isn't generally available. We can add this material to a custom library for your company. For information on getting a material in the Library, please see this order form.
Modifying a Material in the Library
You are able to modify the integrated reflectance of reflective materials, the integrated reflectance and transmittance of transmissive materials, and the index of refraction and extinction coefficient of refractive materials. The integrated reflectance and transmittance values can be changed as a function of incidence angle. You can also change the ratio of the light reflected in a specular manner to that scattered by a material and the ratio of the light transmitted in a straight-through manner to that scattered by the material. You cannot change the distribution of the scattered light from materials, however, as this data is measured in our BRDF/BTDF device and stored in binary format. Following are descriptions of the material files:
Reflective Material Files:
Filename.rfl - ASCII file of integrated reflectance values at each incidence angle. Files can contain an arbitrary angle set, so long as 0, 90 and 180 degrees are included. Valid reflectance values range from 0.0 to 1.0.
Filename.brd - Binary file of the BRDF data for a material. This file cannot be modified. A .brd file only 2 bytes in size indicates the material is specular.
Filename.rsc - ASCII file specifying the ratio of the reflected light that is reflected in a specular manner. Note that these are not the specular reflectance values, but the fraction of the reflected light that is specular at each angle. To derive specular reflectance from these values, multiply these values by the reflectance at each incidence angle. Valid values range from 0.0 to 1.0. This file may or may not be associated with a material. A data byte indicating whether or not the material has a specular reflectance component is contained in the .brd file.
Transmissive Material Files (includes reflective files above, plus the following):
Filename.trn - ASCII file of integrated transmittance values at each incidence angle. Files can contain an arbitrary angle set, so long as 0, 90 and 180 degrees are included. Valid transmittance values range from 0.0 to 1.0.
Filename.btd - Binary file of the BTDF data for a material. This file cannot be modified. A .btd file only 2 bytes in size indicates the material is clear or image-preserving.
Filename.tsc - ASCII file specifying the ratio of the transmitted light that is transmitted in a straight-through manner. Note that these are not the straight-through transmittance values, but the fraction of the transmitted light that passes through un-scattered at each angle. To derive straight-through transmittance from these values, multiply these values by the transmittance at each incidence angle. Valid values range from 0.0 to 1.0. This file may or may not be associated with a material. A data byte indicating whether or not the material has a straight-through transmittance component is contained in the .btd file.
Refractor Materials Files:
Filename.rfc - ASCII file containing 3 values: the index of refraction of the outside medium (usually assumed to be air at 1.0), the index of refraction of the material averaged over the visible spectrum, and the extinction coefficient in units of inches. Note that the extinction coefficient is applied in the equation: Trans = e^(k*L), where e is the exponential (2.71Ö), k is the extinction coefficient, and L is the distance the ray travels in the material in inches. Thus, k is a value per inch.
To Modify Material Files:
You can modify any of the ASCII files described above with a text editor such as Notepad. If you want to create a new version of a file without changing the original copy, then follow the specific instructions below:
- Go to the \Photopia\Lib subdirectory.
- Find a material that has all of the same general characteristics as the new material you wish to create. For example, pick PAINT001 if you want a reflective material that has a specular component.
- Copy all of the files for the original material to files with a new filename of your choice. Keep the filename prefix to 8 characters or less.
- Modify the data in the files as you require.
- Add a reference to your new material in either the Reflect.lib, Transmit.lib, or Refract.lib file, depending on if your file is reflective, transmissive, or refractive, respectively. These files are ASCII files. Open the proper file in Notepad or another ASCII file editor and copy the last line in the file to a new line. Then modify the data as you require. There are 5 entries on each line, with each piece of data separated by a TAB character. In order, the data is: manufacturer, designation, description, value (either nadir reflectance, nadir transmittance, or index of refraction), and material filename prefix.
- Save and close the .lib file and then your new material should be listed inside Photopia.
Differences Between Refractive and Transmissive Materials
Transmissive surfaces are modeled as infinitely thin surfaces in the CAD model and all optical properties of the physical material are assigned to this surface. When a ray strikes a transmissive surface all of the effects of the thick material are accounted for at this single ray/surface interface. The amount of reflected, transmitted and absorbed light is dictated by the material's .RFL and .TRN files which list the reflectance and transmittance as a function of incidence angle, respectively. The scattering properties for the reflected and transmitted light are dictated by the BRDF and BTDF data, respectively. The "front" side of the material always has reflectance and transmittance properties and the "back" side has data on only some of the materials in the library. Examples of transmissive materials are clear glass and plastics, white translucent materials, isotropic* prismatic lenses and isotropic perforated materials.
Refractive surfaces model the entire volume of a lens including the inside, outside and side surfaces. When a ray strikes a refractor surface from the "outside" (from the air, for example), it is partially reflected and refracted according to Fresnel's Equations and Snell's Law of Refraction, respectively. Light is also absorbed within the material according to the path length within the material and the material's extinction coefficient. Once rays have entered into a refractor material such as glass, Photopia searches for intersections with other refractor surfaces on all refractor layers in the model. Once an intersection is found, the ray is either partially internally reflected and partially refracted out or it is Totally Internally Reflected (TIR) back into the material, depending on the incidence angle.
Clear lenses can be modeled with either Transmissive or Refractive surfaces. Transmissive surfaces will result in a faster analysis. If the lens is curved, then only the inside surface of the true lens shape should be modeled if making it a Transmissive surface. If the curvature and thickness of the clear lens are such that there might be some refractive effects, then it should be modeled as a Refractor using its true geometry and thickness.
*Isotropic materials are those for which their orientation within the plane of the material is not important. For example, a flat sheet of translucent white plastic can be rotated within the plane of the material and the scattering of the incident light will be unaffected. If a material such as a plastic lens with extruded linear prisms was rotated there would be a significant difference between the scattered light patterns. The effects of the prisms on the light are different depending on whether the light strikes the prisms from within a plane that is parallel, perpendicular or some other orientation to them. Such materials are referred to as anisotropic. A perforated material is isotropic if it has round holes in a regular pattern, but it would be anisotropic of it contained linear slots.
When to Use the Solid Model Versions of Transmissive Materials
Transmissive materials use BRDF & BTDF files to characterize how light reflects and transmits when it is incident upon the material. When a ray strikes a transmissive surface in Photopia, the appropriate reaction is applied to the ray using the BRDF & BTDF data. The important point to note is that the measured BRDF & BTDF data takes into account the effects of the full material thickness. So when a ray in Photopia strikes an infinitely thin polygon with a transmissive material assigned to it, the full reaction of the physical material (with a thickness) is accounted for at this single ray/polygon interface.
When a CAD model is constructed as a solid, every part has a thickness. Thus, if a prismatic lens or white diffuser material is drawn as a solid, it will be constructed with the thickness of the physical part. When this model is exported to Photopia via a STL file it imports as a mesh of polygons that cover the surface of the original solid model. If a transmissive material is assigned to the mesh that models this lens, then a ray will encounter 2 surfaces when passing through the material model. Since the full effect of the material is accounted for at the first ray/surface interaction, it will then be accounted for twice if the ray then strikes a second surface of the lens.
To avoid this problem, we have made special versions of the transmissive materials where the second surface is ignored in such a case. These are the Solid Model versions of the transmissive materials and they should be used when the CAD model was constructed as a solid model. Note however, that the Solid Model versions of the materials only produce the proper effect if all of the surfaces of the lens model are oriented so that their "front" side is facing to the outside of the part. Thus, if the part is on a layer with a color of white, then the part should be rendered as white from all points of view when viewed in the Show Surface Orientation model in Photopia. This is important because the way that the Solid Model materials work is to have the reaction on the "back" side of the material be perfectly transmissive. So when the ray encounters the second surface of a lens model, it strikes the "back" side and is allowed to pass directly through with no losses or scattering.
One significant consequence of this is that it prohibits (or at least limits) the use of materials with different properties on each side. Materials that have a textured surface on one side and a smooth finish on the another, for example, can be properly modeled with a single, infinitely thin surface in Photopia since we can assign unique BRDF & BTDF data to each side of the material. But in the case of Solid Model materials, the "back" side must be set to be perfectly clear, so this flexibility is lost. This is why all of the Solid Model materials in the library are for materials that are the same (or mostly the same) on both sides. If you have a need for another material to be made into a Solid Model material, then contact us about making a new material for you. It is possible to make Solid Model materials for materials that are different on each side as long as light is only incident onto one side of the lens in the luminaire model.
Volumetric Scattering
Background
Beginning with Photopia 2017, Photopia and Photopia for SOLIDWORKS support volumetric scattering refractive materials. This is for materials which scatter light within their volume, usually via pigment or diffusion particles. These are a special class of Refractive materials, and as such require the General Refractor Module or Photopia Premium. Volumetric scattering can also be used along with spectral material properties to model phosphor particles suspended in a clear material.
Description
Photopia uses a specific XML formatted file for defining the material properties. For Volumetric Scattering, the scattering is described by the Beer-Lambert Law. Photopia accounts for the extinction coefficient within the clear base material, the scattering coefficient (likelihood to scatter), the absorption of the scatter reaction, as well as the distribution and energy conversion of the scatter reaction.
Full details are provided in this Volumetric Scattering Documentation.
Spectral Materials
Background
With Photopia 2015, we introduced the ability to set spectral properties for materials. For spectral materials to function, a raytrace must be set as an SPD raytrace. You must also have appropriate .material, .spdrfc, .spdrfl, .spdtrn, and .spdmatrix files.
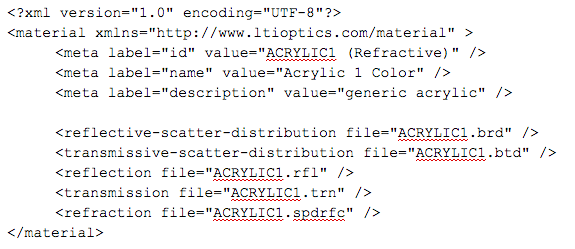
.material file
Each spectral material must have a .material file. This is an XML based file that tells Photopia what files contain the data for the given material.
- the label “id” must have “matlname (matl type)
- depending on the material type, lines for the brd,btd,rfl,trn,rfc,spdrfc,spdrfl,spdtrn can be included
- for refractive materials, if brd/btd/rfl/trn files are included then the material will refract but use the scattering data (no more flags in the rfc file)
- the individual file names do not matter, however their extensions must be appropriate
.spdrfc file
A .spdrfc file is used for refractors where either the index of refraction or the absorption coefficient or both vary with wavelength.
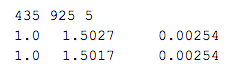
- name does not need to match .matlname, but must be referenced in the .material file
- 1st row: start wavelength, end wavelength, wavelength increment in nm
- additional rows: outside index of refraction (typically air), inside index of refraction, extinction coefficient
.spdrfl file
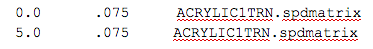
The .spdrfl file is the spectral reflectance. The file lists a scale value and then the name of an spdmatrix file for each incident angle.
- name does not need to match matlname, just spdrfl in the .material file
- incidence angle, scale value, spdmatrix filename
- scale value is applied to each value in the matrix
.spdtrn file
The .spdtrn file is the spectral transmittance. The file lists a scale value and then the name of an spdmatrix file for each incident angle.
- name does not need to match matlname, just spdtrn in the .material file
- incidence angle, scale value, spdmatrix filename
- scale value is applied to each value in the matrix
.spdmatrix file
The .spdmatrix file is the spectral material operator file. The format is the same for reflective or transmissive materials. This file can describe something as simple as a paint color or color filter, or it can describe the complex behavior of a phosphor or other wavelength conversion material.
- name does not need to match matlname
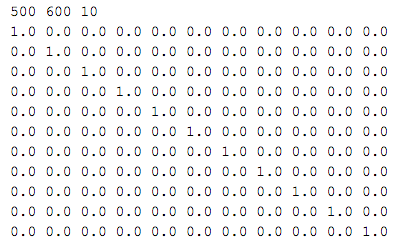
- 1st row: start wavelength, end wavelength, wavelength increment in nm
- additional rows: square matrix of wavelength conversion data
- rows are the input nm, columns are the output nm
- for a material that does not convert energy, the matrix will only have values on the diagonal, with zeros in all other locations
- the sum of each row of the matrix must be less than 1 to satisfy conservation of energy
Suggested Raytrace Settings
Since Photopia is a probabilistic based raytracing program, the results get more accurate as more rays are traced. The number of rays that are required to obtain accurate results depends on the level of "resolution" you have specified, in other words, the level of detail in the results. You can view the results such as the candela polar plot and the illuminance plane shaded plot and watch as they vary around their final values with each update as the raytrace proceeds. The default update frequency is 10%, so you see results at 10%, 20% and so on until the raytrace is finished. The least detailed result is the luminaire efficiency (LOR). This is a single number that represents how many lumens exit the luminaire compared to how many lumens were generated by the lamps. The exact direction of the exiting lumens is not critical when determining the efficiency. Thus, you can see that the efficiency changes very little after the first update of the results during the raytrace. The candela distribution requires much more detail to be resolved since Photopia needs to determine exactly how many lumens belong in all of the angular zones of the distribution. The more angles that are specified in the distribution, the smaller the angular zones and thus the more rays it takes to determine the correct proportions of lumens in all zones. The most level of detail is generally required for the illuminance planes. Whereas the angular zones in the candela distribution might be separated by 2.5 or 5 degrees, the small patches in a high-resolution illuminance plane might be separated by fractions of a degree in angular spread. With this general understanding, we make the following recommendations for the Raytrace and Photometric Output settings. Keep in mind that these are only general recommendations and you can vary these values as long as you understand the consequences.
Raytrace & Photometric Output Setting Recommendations
| Applications | Photometry Type | # of Rays - Initial Evaluation | # of Rays - Final Evaluation | # of Reflections - No Lens | # of Reflections - With Lens | Vertical Angle Increment | Horizontal Angle Increment |
|---|---|---|---|---|---|---|---|
| Wide Beam | C | 500,000 | 5,000,000 | 15 | 25 | 5 | 15 |
| Narrow Beam | C | 500,000 | 5,000,000 | 15 | 25 | 2.5 | 15 |
| Very Narrow Beam | C | 500,000 | 5,000,000 | 15 | 25 | 1 | 15 |
| Roadway or Area Light | C | 2,500,000 | 10,000,000 | 15 | 25 | 5 | 5 or 10 |
| Wide Beam Floodlight | B | 2,500,000 | 10,000,000 | 15 | 25 | 5 | 5 |
| Very Narrow Beam | B | 2,500,000 | 10,000,000 | 15 | 25 | 2.5 | 2.5 |
*Note: When using CFL lamps, we recommend that you turn ON the Lamp Shadow Check option. This options can be left off for most other lamp types. All other raytrace settings can generally be left at their default values.
Energy Units
Photopia 2015 introduced the ability so set the output units to lumens, radiant watts, μmol photons / sec and μmol photons / sec in the 400-700nm range (PAR). This allows the use of Photopia for a wide range of applications from general lighting to agriculture and radiant heating.
Under Setting > Project Settings there is a setting for "Lamp Flux Energy Units". Set this to the units you wish to see for your input and output. You can update your lamp energy values under Edit > Design Properties.
IESX Files
The IESX file contains color/spectral data for each angle in the intensity distribution. This is an XML format file, using a pre-release version of a future IES file format that has been expanded to support luminaire color data. The data in this file can most easily be viewed by opening it in Excel, using a reference style sheet file that tells Excel how to format the data. The style sheet file is named "iesxToText.xslt" and is installed in the following folder on your computer:
C:\Users\Public\Documents\LTI Optics\Photopia\Utilities
Put a copy of this file in the same folder as your IESX file. Then open the IESX file in Excel. At the "Import XML..." pop-up dialog, choose the 2nd option:
"Open the file with the following stylesheet applied (select one):"
It will default to iesxToText.xslt, so keep that option.
Then choose "Delimited" on the Text Import Wizard dialog, then click Next and then choose Comma as the delimiter.
Then click Finish.
The first row in the spreadsheet will include the column labels. If you chose the "Power distribution raytrace" option in Photopia, then the full spectral values will be listed for each angle in the beam at the nm resolution you specified.
Photometry
Conventions
Having the correct Photometric Settings is critical to obtaining accurate results from Photopia. When you send a product for testing, the laboratory often determines the correct photometric angles, but when you are running Photopia it is something you must always be aware of. The angle sets are often broken down to vertical and horizontal angles, described below.
Having the correct Photometric Settings is critical to obtaining accurate results from Photopia. When you send a product for testing, the laboratory often determines the correct photometric angles, but when you are running Photopia, it is your responsibility to use the correct settings. For architectural lighting, most photometry is Type C with horizontal and vertical angle sets as described below. For more information, see the Photometric Settings section of the User's Guide.
Vertical Angles
Vertical photometric angles go from directly below the fixture at 0 degrees to directly above at 180 degrees. The vertical angles that you choose are governed by the vertical distribution of your product. See the table below for information on the correct choice of vertical angles.
| Direct | Indirect | Direct/Indirect | |
|---|---|---|---|
| Distribution | Light Directed Downward | Light Directed Upward | Light Directed Upward and Downward |
| Orientation | Beam in -z direction | Beam in +z direction | Beam in -z direction |
| Vertical Angles | 0-90 degrees | 90-180 degrees | 0-180 degrees |
Horizontal Angles
The horizontal photometric angles that you will choose depend on the horizontal symmetric of your product. Fixtures can have four types of symmetry, as outlined in the table below. In Photopia it is important to choose the correct angle set based on the fixture symmetry because otherwise the output can become incorrect. Photopia always has data for the full 0-360 degrees, but averages down to the angle set that you choose. In the extreme case all 360 degrees are averaged together when you choose a horizontal angle of "0" only.
| Axially Symmetric | Quadrilaterally Symmetric | Bilaterally Symmetric | Completely Asymmetric | |
|---|---|---|---|---|
| Examples | Revolved Downlights | Louvered Fluorescent | "Asymmetric" Fluorescent Wallwash, Roadway | Directional Tunnel Lighting |
| Lamp Orientation | Along y axis | |||
| Outside U.S. | Along x axis | |||
| Beam Direction | Along +y axis | |||
| Horizontal Angles | 0 degrees only | 0-90 degrees | 0-180 degrees | 0-360 degrees |
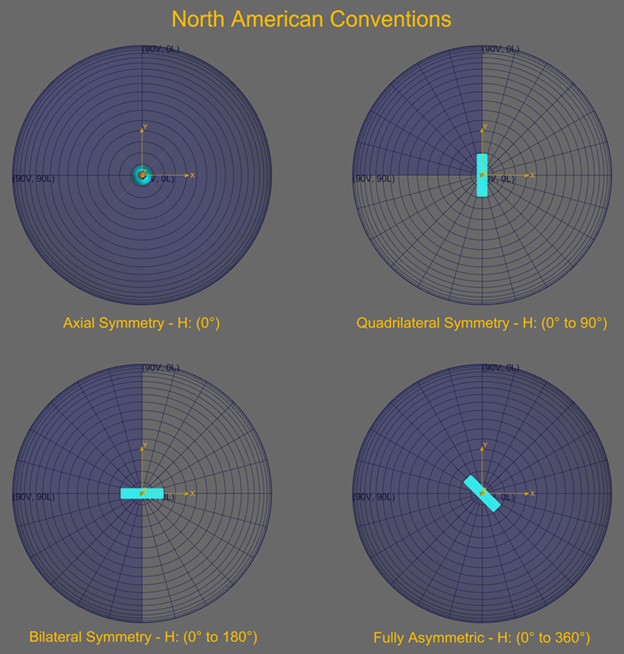
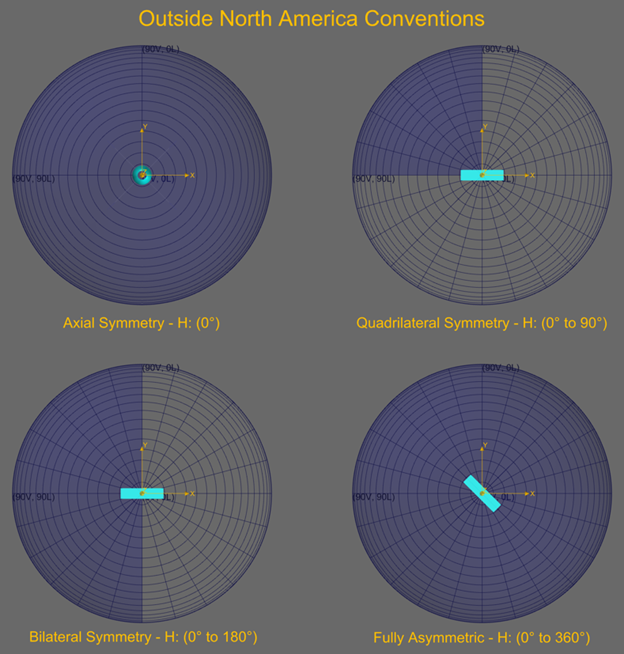
Distribution
As Photopia has come to be more widely used in the architectural lighting industry, an increasing number of Photopia generated photometric files are being distributed by lighting manufacturers to their customers. By photometric files, we are referring to IES files in North America and TM-14 or EULUMDAT in other regions of the world.
The original intent of Photopia was to allow manufacturers to develop new designs more quickly and more cost effectively by evaluating their design ideas on their computer instead of building and testing each and every design alternative. Once the predicted design performance met the desired criteria, a prototype was built and physically tested. If the physical test did not meet the design requirements, then modifications would be made until the requirements were met. In many cases, this involved troubleshooting the design to ensure it was built to specifications, so that it matched what was modeled in Photopia.
Photopia is no longer only used in the development of new standard products. It is also used to model the performance of custom luminaires where the time from concept to installation does not allow for the classic product development cycle. Additionally, it is being used to model some existing products for which photometric testing was never before required. In these cases and others, some manufactures will distribute photometric files generated by Photopia.
Whenever a photometric file generated by Photopia is distributed to a customer, the data should be as accurate as possible. The consequences of the photometric data not being accurate can be very costly if you are called out to fix an installed job. The distribution of inaccurate data also hurts Photopia's reputation and therefore its overall value. So it is in everyone's interest to ensure photometric data generated by Photopia is as accurate as possible.
While Photopia's accuracy has been confirmed by our own experience as well as that of our customers, the accuracy is dependent upon several critical factors, including but not limited to the following:
For more information about the factors that affect the accuracy, see Appendix C of the User's Guide.
Guidelines for Distributing Photometric Files:
If you do distribute IES files generated by Photopia, then please follow this advice:
Thank you for your attention to this issue.
The Photopia Product Support Team
Labs
While Photopia is excellent for simulating photometry, there are often times when you must use a physical lab. These may include:
There are many labs available for photometric testing. We would recommend the following labs:
File Formats
Photopia makes use of a range of file formats.
- IES - The standard format used by North American luminaire manufacturers for transferring product photometric distribution data, specifically IES LM-63-2002 format.
- IESX - The new IES standard which includes color data as well, defined in IES TM-33.
- LDT - Format commonly used by European manufacturers.
IES - LM-63
This standard format maintained by the IES contains the intensity distribution of a product in photometric units (lumens & candelas) and cannot contain any color or spectral information.
The IES photometric file is an ASCII file with the format shown below. Items inside the {{ }} brackets are brief data descriptions. Items surrounded by [ ] brackets are keywords that must be present. Multiple data on the same line shall be separated by either a comma or at least one space. The {{ }} brackets themselves should not be present in the file. Full details of the file format are defined in the IES LM-63-2002 standard document, avaliable for purchase.
IESNA:LM-63-1995
[TEST] ...
[MANUFAC] ...
[keyword 3]
...
[Keyword n]
TILT=tilt file name -or- INCLUDE -or- NONE {{ Most common }}
{{ number of lamps }} {{ lumens per lamp }} {{ candela multiplier }} {{ number of vertical angles }} {{ number of horizontal angles }} {{ photometric type (1,2 or 3) }} {{ units (1 or 2) }} {{ width }} {{ length }} {{ height }}
{{ ballast factor }} {{ ballast lamp factor }} {{ input watts }}
{{ vertical angles }}
{{ horizontal angles }}
{{ candela values for all vertical angles at first horizontal angle }}
{{ candela values for all vertical angles at second horizontal angle }}
.
.
{{ candela values for all vertical angles at last horizontal angle }}
IESX - TM-33
This standard format maintained by the IES contains the intensity distribution of a product in photometric units (lumens & candelas), but can also contain this in radiometric or spectral units, as well as other data like integrating sphere results.
LDT - Eulumdat
Although widely used, the Eulumdat file (LDT) is not defined or maintained by a standard body. The Eulumdat file is widely used outside of North America. It contains the intensity distribution of a product in photometric units (lumens & candelas) and cannot contain any color or spectral information.
Application Software
Lighting Application Software is typically used by lighting designers, electrical engineers, or architects to determine how many of what type of luminaire are required in a given space to achieve a certain light level or effect. There are currently several pieces of lighting application software that are widely used.
- AGi32 - Commercial software widely used by lighting designers.
- Visual - Software from Acuity Brands Lighting.
- Relux - Software sponsored by manufacturers, free for users.
- DIALux - Software sponsored by manufacturers, free for users.
* This list is not meant to be comprehensive or an endorsement of any particular software, but merely as a resource for our customers.